
 Chinese
 Russian
 Arabic
Recently, the latest first-quarter transaction data from our China Automobile Dealers Association came out. The overall transaction data is similar to our judgment, with a slight increase. Judging from the transaction volume, it is OK. However, due to the superposition of problems such as single vehicle gross profit margin, turnover rate and loss ratio, it is actually transmitted to the actual operators of used cars. The feeling is that this year seems to be even more difficult!
Cars that are easy to sell cannot be received or dare not accept, cars in stock cannot be sold, and no one even wants to cut off their meat. It seems that the customers have all fled, where have they gone? Overall depression and confusion are common.
Coupled with the changes in the international situation in early April, it is difficult for everyone to judge where to go?
Take a look at the overall market performance analysis:

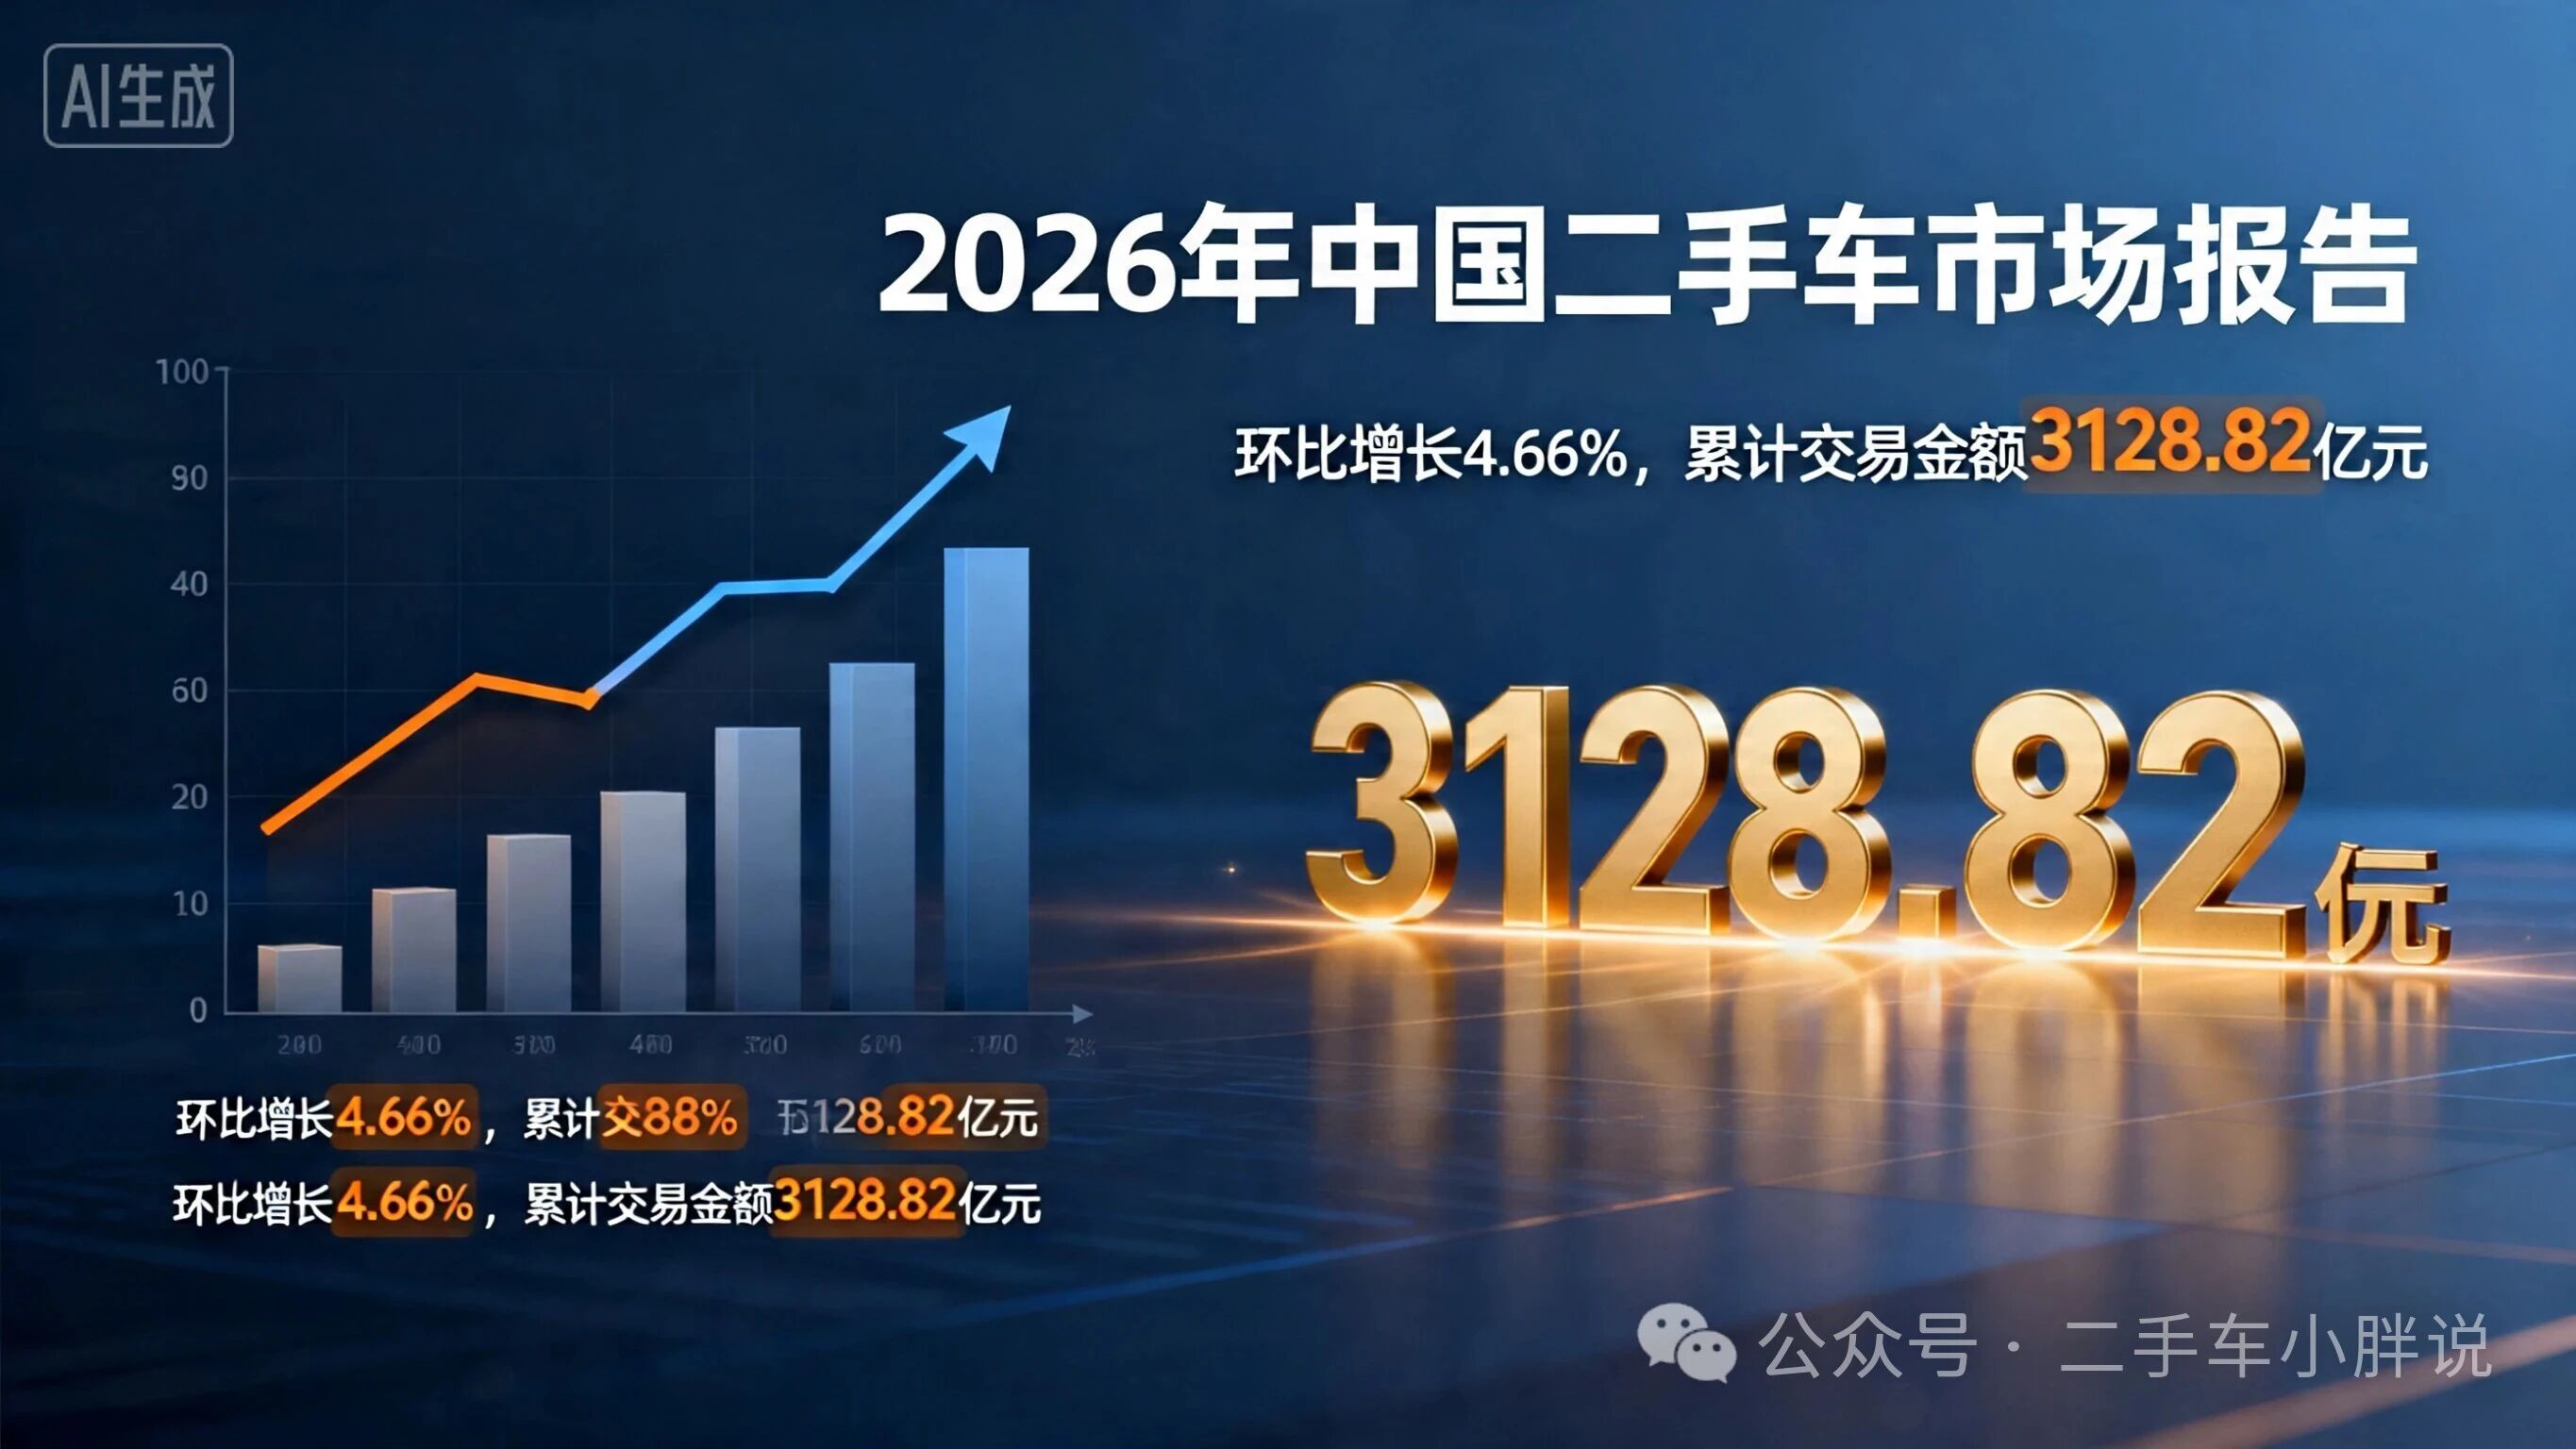
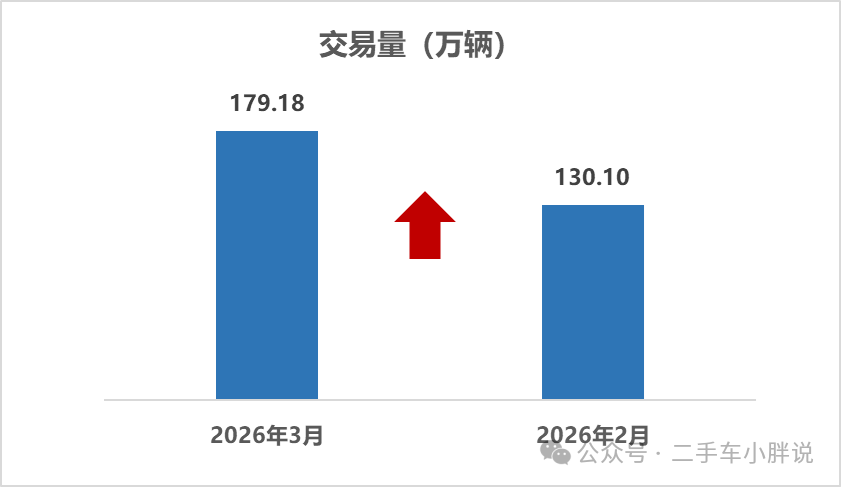
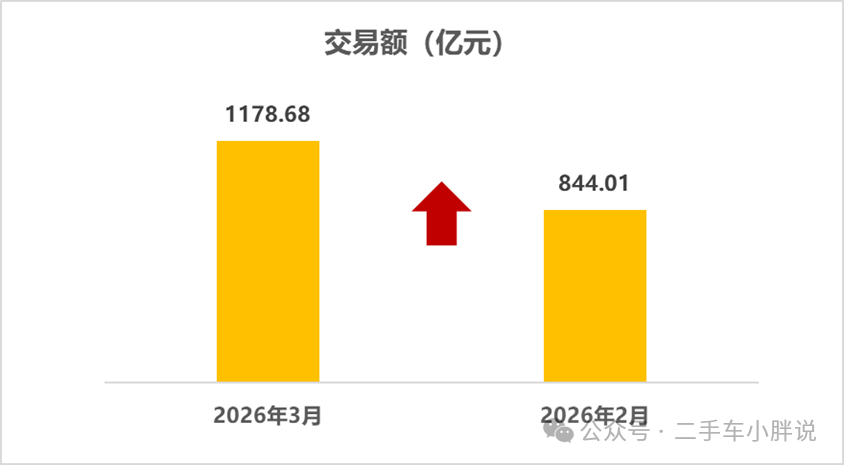
Overall performance of the used car market in March 2026
In March 2026, the transaction volume of the national used car market was 1.7918 million units, a month-on-month increase of 37.73%, a year-on-year increase of 2.11%, and the transaction amount was 117.868 billion yuan.
From January to March 2026, the cumulative transaction volume of used cars was 4.822 million, a year-on-year increase of 4.66%, an increase of 214,600 compared with the same period, and the cumulative transaction amount was 312.882 billion yuan.
Structural analysis of used car models in March 2026
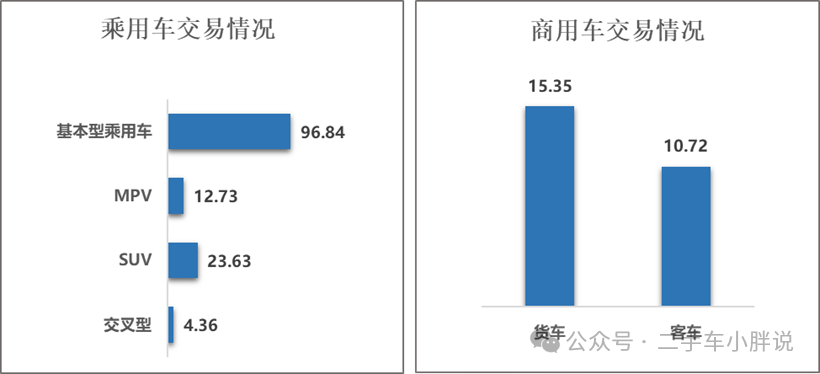
Passenger car situation:In March, a total of 968,400 basic passenger cars were traded, a month-on-month increase of 38% and a year-on-year decrease of 3.45%; a total of 236,300 SUVs were traded, a month-on-month increase of 35.43% and a year-on-year increase of 1.36%; A total of 127,300 MPVs were traded, a month-on-month increase of 38.49% and a year-on-year increase of 12.06%; a total of 43,600 cross-type passenger cars were traded, a month-on-month increase of 37.52% and a year-on-year decrease of 3.22%.
Commercial vehicle situation: A total of 107,200 passenger cars were traded, a month-on-month increase of 36%, and a year-on-year increase of 8.76%; 153,500 trucks were trucks, a month-on-month increase of 38.1%, and a year-on-year increase of 6.64%.
In March, with the end of the Spring Festival holiday, used car dealers fully resumed work, consumer demand continued to be released, and the market entered a stage of steady recovery and accelerated recovery. The overall trend showed a general month-on-month increase and a year-on-year differentiation. In terms of passenger cars, basic passenger cars and cross-type passenger cars declined slightly year-on-year, while SUVs and MPVs achieved year-on-year growth. Among them, MPVs increased significantly year-on-year, reflecting the continued release of consumer replacement demand and household and business needs. At the same time, it also reflects the differences between different passenger car categories affected by the adjustment of the market environment and consumption structure; the performance of commercial vehicles continues to improve, and passenger cars and trucks both achieve year-on-year growth, continuing the resilience of demand for production and operation vehicles.
1-3 In March, a total of 3.7125 million passenger cars were traded, a year-on-year increase of 0.88%. Among them: a total of 2.6159 million basic passenger cars were traded, a year-on-year decrease of 1.17%; a total of 641,300 SUVs were traded, a year-on-year increase of 4.05%; a total of 339,000 MPVs were traded, a year-on-year increase of 12.8%; a total of 116,300 cross-type passenger cars were traded, a year-on-year decrease of 0.14%.
A total of 700,300 commercial vehicles were traded, a year-on-year increase of 12.21%. Among them: a total of 413,000 trucks were traded, a year-on-year increase of 13.12%; 287,300 passenger cars were sold, a year-on-year increase of 10.93%.
1-3 In September, the used car market as a whole showed operating characteristics of moderate growth in total volume and continuous optimization of structure. Although seasonal fluctuations occurred in some months due to the impact of the Spring Festival holiday, as the market gradually recovered after the holiday and consumer demand continued to be released, the cumulative transaction volume of passenger cars and commercial vehicles achieved year-on-year growth. Among them, the growth rate of commercial vehicles was significantly higher than that of passenger vehicles, indicating that production and operating demand has recovered more strongly; the passenger car segment showed a differentiated growth trend, with MPV and SUV leading the growth rate, and basic passenger cars and crossover passenger cars declined slightly. The overall market fluctuated in stages due to seasonal factors, but the cumulative trend was stable and the recovery momentum continued to show.
Analysis of the service life of used car trading vehicles in 2026
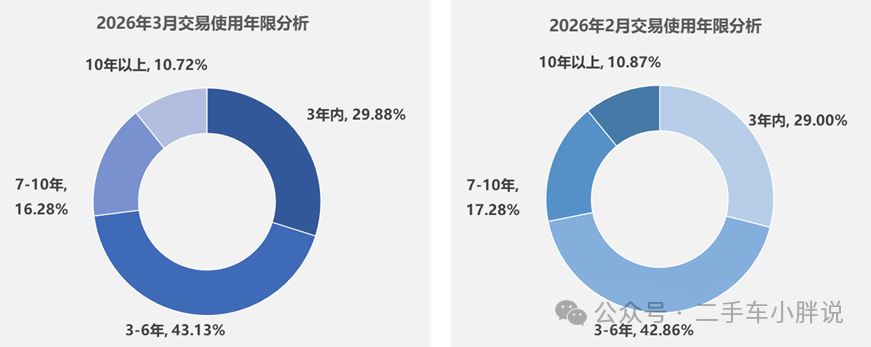
In March, second-hand cars with a service life of 3-6 years accounted for the largest proportion, accounting for 43.13%, a month-on-month increase of 0.27% and a decrease of 2.57% compared with the same period last year; Models with a service life of 3 years accounted for 29.88%, a month-on-month increase of 0.88%, and an increase of 2.29% compared with the same period last year; Models with a car age of 7-10 years accounted for 16.28%, a month-on-month decrease of 1.01%, and an increase of 0.27% compared with the same period last year; The proportion of models older than 10 years old was 10.72%, a month-on-month decrease of 0.15%, and an increase of 0.02% compared with the same period last year.
In March, the age structure of the used car market showed the characteristics of demand-driven and coordinated growth of old and new car sources. The proportion of 3-6-year-old models in mainstream circulation still ranks first. In the three years, the proportion of quasi-new models has increased month-on-month and year-on-year. However, the proportion of medium-to-high and old models over 7 years old has dropped month-on-month, and has remained year-on-year. Small growth trend.
Overall, the market age distribution is in line with spring consumer demand. Quasi-new cars and mainstream vehicle sources jointly support the market recovery. Coupled with the guidance of the old-for-new policy, the industry's circulation structure continues to improve.
Analysis of the six major regions in March 2026
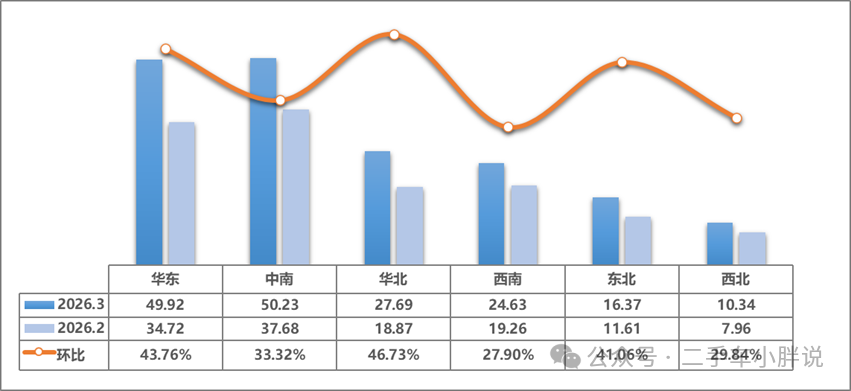
In March 2026 The market is characterized by "global recovery, core leadership, and significant differentiation". Core cities and coastal economic belts have taken the lead and become the core engines driving regional growth. The national market has entered a rapid post-holiday recovery channel.
The trading volume of used cars in East China was 499,200 units, a month-on-month increase of 43.76%. The growth rate ranked among the top six regions, and the market has comprehensively recovered. The performance of core cities in the region was particularly outstanding. Shanghai doubled its month-on-month growth rate, becoming the absolute main force of regional growth; Jiangsu and Fujian had similar month-on-month growth rates, with 52.3% and 42.4% respectively, with strong demand release; Zhejiang, Anhui, Jiangxi, Shandong and other provinces have a month-on-month growth rate of between 30% and 35%. All provinces and cities in the region are recovering in a coordinated manner. East China's leading position as the country's largest used car trading area has been further consolidated. Consumption vitality and circulation in the coastal economic belt Efficiency advantages are highlighted.
The trading volume of used cars in Central and South China was 502,300 units, a month-on-month increase of 33.32%. It surpassed East China with a slight advantage and became the region with the highest transaction volume in the country. Regional domestic demand support is strong. Hubei, Hunan and Hainan have similar month-on-month growth rates, both exceeding 40%, and market activity has increased significantly; Guangdong and Guangxi have increased month-on-month growth rates of 35.6% and 22.4% respectively, maintaining steady growth; Henan has increased month-on-month growth of 16.6%, the growth rate is relatively flat but has a huge base, providing solid support for the regional total to lead.
The trading volume of used cars in North China was 276,900 units, a month-on-month increase of 46.73%, the highest growth rate among the six major regions. Regional growth showed a pattern of "strong driving by core cities and comprehensive follow-up by provinces". Beijing's month-on-month growth has doubled, and together with Shanghai has become the dual core of the national recovery, completely reversing the downturn in February; Tianjin, Inner Mongolia, Shanxi, and Hebei The month-on-month growth rate is concentrated between 31% and 43%, all achieving rapid growth of more than 30%. The coordinated recovery effect of Beijing, Tianjin and Hebei is significant, and demand in the northern core economic circle is concentrated.
The trading volume of used cars in Southwest China was 246,300 units, a month-on-month increase of 27.90%. The growth rate was relatively flat among the six major regions but the recovery trend was solid. In the region, the month-on-month growth rates in Xizang and Sichuan were similar, with outstanding performance; the month-on-month growth rates in Chongqing, Yunnan and Guizhou were concentrated between 20% and 25%, maintaining stable growth. The southwest region was deeply affected by the previous holidays. The pace of repair was orderly in March, the regional market structure continued to be optimized, and the vitality of the western market was gradually released.
The trading volume of used cars in Northeast China was 163,700 units, a month-on-month increase of 41.06%. Taking advantage of the post-holiday consumption recovery opportunity, the market rebounded rapidly, highlighting the strong resilience of the regional market. The three provinces in the region have similar month-on-month growth rates, all close to 40%. Among them, Heilongjiang leads the Northeast region with an increase of 45.4%, while Liaoning and Jilin have 38.9% and 38.7% respectively.
The trading volume of used cars in the northwest region was 103,400 units, a month-on-month increase of 29.84%, and the market was recovering steadily. Qinghai in the region grew by 42.4% month-on-month, showing an outstanding performance; Gansu and Ningxia had similar month-on-month growth, both at about 32%, achieving rapid growth; Shaanxi and Xinjiang had a month-on-month growth rate concentrated between 25% and 29%, steadily recovering. The overall base of the northwest region is small, the pace of recovery is relatively stable, and it is gradually returning to normal trading levels.
Cross-regional circulation in 2026
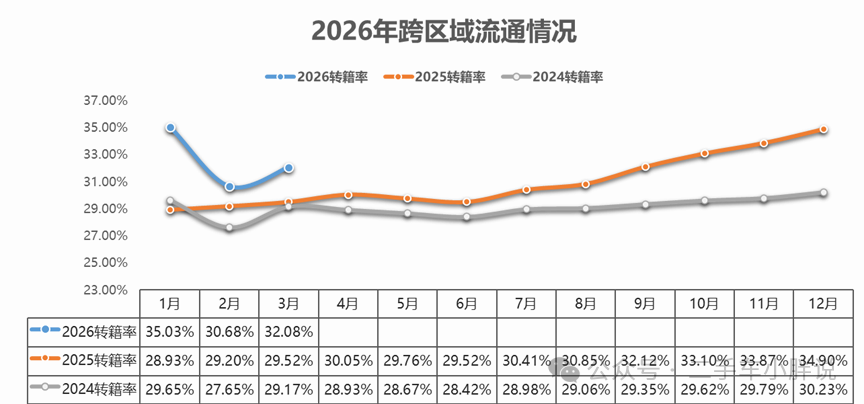
In March, the second-hand car transfer rate was 32.08%, an increase of 1.41% month-on-month and a year-on-year increase of 2.57% year-on-year. The total number of second-hand car transfers was 574,900, a month-on-month increase of 44.04% and an increase of 10.99% compared with the same period last year.
Source: Used car Xiaopang said
[Disclaimer] The content of this website (including pictures and texts) originates from the Internet, and the copyright belongs to the original author. Respect the rights and interests of originality, and select content is only used for information sharing. If copyright disputes are involved, please contact us to handle them in a timely manner
 Online Evaluation
 I am Buyer
 Export Services
 subsites


 023-62852688
  No. 1-1, No. 2899, Longzhou Avenue, Banan District, Chongqing City
 Headquarters


